<?xml version="1.0" encoding="utf-8"?><feed xmlns="http://www.w3.org/2005/Atom" ><generator uri="https://jekyllrb.com/" version="3.10.0">Jekyll</generator><link href="http://ahadas.com/feed.xml" rel="self" type="application/atom+xml" /><link href="http://ahadas.com/" rel="alternate" type="text/html" /><updated>2026-01-22T19:06:09+00:00</updated><id>http://ahadas.com/feed.xml</id><title type="html">Arik Hadas</title><subtitle>Yet Another Developer&apos;s Blog</subtitle><entry><title type="html">Production observability of agentic AI with MLflow</title><link href="http://ahadas.com/mlflow-otel/" rel="alternate" type="text/html" title="Production observability of agentic AI with MLflow" /><published>2026-01-22T00:00:00+00:00</published><updated>2026-01-22T00:00:00+00:00</updated><id>http://ahadas.com/mlflow-otel</id><content type="html" xml:base="http://ahadas.com/mlflow-otel/"><![CDATA[<p>It’s been a while since I posted here, but as part of my work on OpenShift AI (that transition could be a topic for another post), I expect to have more interesting content to share. This post covers an exploration I participated in, focused on sending traces to MLflow for monitoring agentic workflows in production.</p>

<h1 id="background">Background</h1>

<p>MLflow is known for its capabilities in managing the machine learning lifecycle. <a href="https://www.linuxfoundation.org/press/press-release/the-mlflow-project-joins-linux-foundation">It’s part of the Linux Foundation</a> and as of version 3 of OpenShift AI, it has become a key component for managing experiment tracking and model registry within OpenShift AI.</p>

<p>Our goal was to explore the observability side of MLflow. Specifically, <a href="https://mlflow.org/docs/latest/genai/eval-monitor/running-evaluation/traces/">MLflow already covers the evaluation of production traces</a>, and we wanted to investigate ways to integrate that with OpenShift AI and whether it makes sense to visualize more data on the MLflow console.</p>

<h1 id="custom-or-standard-solution">Custom or Standard Solution?</h1>

<p>Full compatibility with OpenTelemetry was introduced in MLflow not long before our exploration (at the end of 2025). This left us with the following choices:</p>
<ol>
  <li>Favor MLflow SDK for the best experience.</li>
  <li>Favor compatibility with OpenTelemetry for standardization.</li>
</ol>

<p>Demonstrations we saw using the MLflow SDK were very impressive. While I have no experience working as a data scientist, the out-of-the-box capabilities of the MLflow SDK, such as automatic trace generation by simply adding an annotation, looked appealing.</p>

<p>However, considering the broader picture, we determined it was worth exploring how it could work with OpenTelemetry instead of the MLflow SDK, especially since there are ways to bridge the gaps (e.g., by complying with <a href="https://arize.com/docs/ax/observe/tracing-concepts/what-is-openinference">OpenInference</a>).</p>

<h1 id="having-a-central-otel-collector">Having a Central OTEL Collector</h1>

<p>There are various ways to integrate MLflow with the typical observability stack in OpenShift. We chose to investigate using an OpenTelemetry collector that would receive traces from different components and export them to the OTEL endpoint of MLflow Tracking Server, as illustrated in the following diagram:</p>

<p><img src="../images/otel-collector-mlflow.png" alt="Propagating traces to MLflow through a central OTEL collector" /></p>

<h1 id="simple-export-fails">Simple Export Fails…</h1>

<p>The very first attempt to export traces to the OTEL endpoint of MLflow Tracking Server failed with an error: “Workspace context is required for this request”. I was already familiar with this error from previous experiments with MLflow and knew it stemmed from an additional layer that was added to verify that a namespace/project is set for the request, which rejected the request.</p>

<p>I used Claude Code to identify the root cause and come up with a fix. A fix <a href="https://github.com/opendatahub-io/mlflow/pull/75">was posted</a> and is expected to get included in a future version of OpenShift AI. With that fix, I was able to post traces from within the MLflow pod using:</p>

<div class="language-bash highlighter-rouge"><div class="highlight"><pre class="highlight"><code>curl <span class="nt">-i</span> <span class="nt">-X</span> POST <span class="se">\</span>
      http://mlflow.opendatahub.svc:9443/v1/traces <span class="se">\</span>
      <span class="nt">-H</span> <span class="s2">"x-mlflow-experiment-id: 8"</span> <span class="se">\</span>
      <span class="nt">-H</span> <span class="s2">"x-mlflow-workspace: opendatahub"</span> <span class="se">\</span>
      <span class="nt">-H</span> <span class="s2">"Authorization: Bearer &lt;token&gt;"</span> <span class="se">\</span>
      <span class="nt">-H</span> <span class="s2">"Content-Type: application/x-protobuf"</span> <span class="se">\</span>
      <span class="nt">-H</span> <span class="s2">"x-remote-user: kube:admin"</span> <span class="se">\</span>
      <span class="nt">--data-binary</span> @trace.bin
</code></pre></div></div>

<h1 id="fixing-a-resolved-issue">Fixing a Resolved Issue…</h1>

<p>Next, I configured an OpenTelemetry collector that can receive traces over gRPC or HTTP and export them to the OTEL endpoint of MLflow Tracking Server:</p>

<div class="language-yaml highlighter-rouge"><div class="highlight"><pre class="highlight"><code><span class="na">apiVersion</span><span class="pi">:</span> <span class="s">opentelemetry.io/v1beta1</span>
<span class="na">kind</span><span class="pi">:</span> <span class="s">OpenTelemetryCollector</span>
<span class="na">metadata</span><span class="pi">:</span>
  <span class="na">name</span><span class="pi">:</span> <span class="s">collector</span>
  <span class="na">namespace</span><span class="pi">:</span> <span class="s">openshift-monitoring</span>
<span class="na">spec</span><span class="pi">:</span>
  <span class="na">mode</span><span class="pi">:</span> <span class="s">deployment</span>
  <span class="na">config</span><span class="pi">:</span>
    <span class="na">receivers</span><span class="pi">:</span>
      <span class="na">otlp</span><span class="pi">:</span>
        <span class="na">protocols</span><span class="pi">:</span>
          <span class="na">grpc</span><span class="pi">:</span> <span class="pi">{}</span>
          <span class="na">http</span><span class="pi">:</span> <span class="pi">{}</span>

    <span class="na">processors</span><span class="pi">:</span>
      <span class="na">batch</span><span class="pi">:</span> <span class="pi">{}</span>
      <span class="na">resource</span><span class="pi">:</span>
        <span class="na">attributes</span><span class="pi">:</span>
          <span class="pi">-</span> <span class="na">key</span><span class="pi">:</span> <span class="s">service.name</span>
            <span class="na">value</span><span class="pi">:</span> <span class="s2">"</span><span class="s">otel-collector-forwarder"</span>
            <span class="na">action</span><span class="pi">:</span> <span class="s">upsert</span>

    <span class="na">exporters</span><span class="pi">:</span>
      <span class="na">otlphttp/mlflow</span><span class="pi">:</span>
        <span class="na">endpoint</span><span class="pi">:</span> <span class="s2">"</span><span class="s">http://mlflow.opendatahub.svc:9443"</span>
        <span class="na">encoding</span><span class="pi">:</span> <span class="s">proto</span>
        <span class="na">compression</span><span class="pi">:</span> <span class="s">none</span>
        <span class="na">headers</span><span class="pi">:</span>
          <span class="na">x-mlflow-experiment-id</span><span class="pi">:</span> <span class="s2">"</span><span class="s">8"</span>
          <span class="na">x-mlflow-workspace</span><span class="pi">:</span> <span class="s2">"</span><span class="s">opendatahub"</span>
          <span class="na">Authorization</span><span class="pi">:</span> <span class="s2">"</span><span class="s">Bearer</span><span class="nv"> </span><span class="s">&lt;token&gt;"</span>
          <span class="na">x-remote-user</span><span class="pi">:</span> <span class="s2">"</span><span class="s">kube:admin"</span>
          <span class="na">Accept</span><span class="pi">:</span> <span class="s2">"</span><span class="s">application/json"</span>
        <span class="na">tls</span><span class="pi">:</span>
          <span class="na">insecure_skip_verify</span><span class="pi">:</span> <span class="no">true</span>

    <span class="na">service</span><span class="pi">:</span>
      <span class="na">pipelines</span><span class="pi">:</span>
        <span class="na">traces</span><span class="pi">:</span>
          <span class="na">receivers</span><span class="pi">:</span> <span class="pi">[</span><span class="nv">otlp</span><span class="pi">]</span>
          <span class="na">processors</span><span class="pi">:</span> <span class="pi">[</span><span class="nv">resource</span><span class="pi">,</span> <span class="nv">batch</span><span class="pi">]</span>
          <span class="na">exporters</span><span class="pi">:</span> <span class="pi">[</span><span class="nv">otlphttp/mlflow</span><span class="pi">]</span>
</code></pre></div></div>

<p>With this configuration, a trace I sent to the collector appeared in the MLflow Tracking Server database. However, I noticed it was being sent multiple times until reaching a retry limit. I’ll spare you the technical details of the issue [1], as the interesting part is about the fix.</p>

<p>I thought this could be another issue I could contribute a fix for, so I asked Claude Code to produce one and was about to submit it to <a href="https://github.com/mlflow/mlflow">the main MLflow repository</a>. However, when rebasing, I discovered <a href="https://github.com/mlflow/mlflow/commit/6887d3a85ab50659ac78e252983b55c379c56887">the issue had already been fixed there</a>! The lesson learned from this is twofold: (A) I’ll need to get used to working with midstream repositories, which didn’t exist in other projects I’ve worked on; and (B) Claude Code doesn’t appear to check parent repositories even when GitHub integration is enabled.</p>

<h1 id="summary">Summary</h1>

<p>All in all, it was nice to see everything working smoothly eventually, as shown in this demonstration:</p>

<p><a href="https://www.youtube.com/watch?v=Kv6HQ5qJkv8"><img src="https://img.youtube.com/vi/Kv6HQ5qJkv8/1.jpg" alt="Demonstration" /></a></p>

<p>It turned out that the above-mentioned architecture considerations weren’t that relevant, as many would have seen the OpenTelemetry approach as the preferred option anyway. There were no surprising findings either. However, it was also nice to become more familiar with MLflow and with development processes in OpenShift AI.</p>

<p>[1] For those interested: the response sent by MLflow was encoded in JSON even though the request was encoded in Protobuf, which violated <a href="https://opentelemetry.io/docs/specs/otlp/#otlphttp-response">the OpenTelemetry specification</a> and resulted in the otelhttp exporter failing to parse the response and attempting to re-export the data repeatedly.</p>]]></content><author><name></name></author><summary type="html"><![CDATA[It’s been a while since I posted here, but as part of my work on OpenShift AI (that transition could be a topic for another post), I expect to have more interesting content to share. This post covers an exploration I participated in, focused on sending traces to MLflow for monitoring agentic workflows in production.]]></summary></entry><entry><title type="html">Push Custom Images to Openshift Local</title><link href="http://ahadas.com/push-to-openshift-local-registry/" rel="alternate" type="text/html" title="Push Custom Images to Openshift Local" /><published>2022-12-02T00:00:00+00:00</published><updated>2022-12-02T00:00:00+00:00</updated><id>http://ahadas.com/push-to-openshift-local-registry</id><content type="html" xml:base="http://ahadas.com/push-to-openshift-local-registry/"><![CDATA[<p>This post describes the next step in our journey to deploy MTV (Migration Toolkit for Virtualization) on Openshift Local: deploying a custom image to Openshift Local without going through an external registry like quay.io</p>

<h1 id="prerequisits">Prerequisits</h1>

<p>Set up an Openshift Local cluster and deploy MTV on it as described <a href="http://ahadas.com/mtv-on-openshift-local/">here</a> (note that you should also make the PVs accessible to the pods for being able to start VMs).</p>

<p>Clone <a href="https://github.com/kubev2v/forklift">the repository of Forklift</a> and make sure you are able to build the image of forklift-controller with <code class="language-plaintext highlighter-rouge">make build-controller</code>.</p>

<h1 id="expose-the-image-registry">Expose the image-registry</h1>

<p>Do the following steps that are taken from the <a href="https://docs.openshift.com/container-platform/4.11/registry/securing-exposing-registry.html">Openshift documentation</a>:</p>

<div class="language-bash highlighter-rouge"><div class="highlight"><pre class="highlight"><code><span class="nv">$ HOST</span><span class="o">=</span><span class="si">$(</span>oc get route default-route <span class="nt">-n</span> openshift-image-registry <span class="nt">--template</span><span class="o">=</span><span class="s1">'{{ .spec.host }}'</span><span class="si">)</span>
</code></pre></div></div>

<div class="language-bash highlighter-rouge"><div class="highlight"><pre class="highlight"><code><span class="nv">$ </span>oc get secret <span class="nt">-n</span> openshift-ingress  router-certs-default <span class="nt">-o</span> go-template<span class="o">=</span><span class="s1">'{{index .data "tls.crt"}}'</span> | <span class="nb">base64</span> <span class="nt">-d</span> | <span class="nb">sudo tee</span> /etc/pki/ca-trust/source/anchors/<span class="k">${</span><span class="nv">HOST</span><span class="k">}</span>.crt  <span class="o">&gt;</span> /dev/null
</code></pre></div></div>

<div class="language-bash highlighter-rouge"><div class="highlight"><pre class="highlight"><code><span class="nv">$ </span><span class="nb">sudo </span>update-ca-trust <span class="nb">enable</span>
</code></pre></div></div>

<div class="language-bash highlighter-rouge"><div class="highlight"><pre class="highlight"><code><span class="nv">$ </span>podman login <span class="nt">-u</span> kubeadmin <span class="nt">-p</span> <span class="si">$(</span>oc <span class="nb">whoami</span> <span class="nt">-t</span><span class="si">)</span> <span class="nv">$HOST</span>
</code></pre></div></div>

<p>Note that the last step above is different than what is written in the above mentioned Openshift documentation, this command shouldn’t be executed with <code class="language-plaintext highlighter-rouge">sudo</code>.</p>

<h1 id="push-an-image-to-the-exposed-registry">Push an image to the exposed registry</h1>

<p>Tag an image with $HOST as the registry and push it, for example:</p>
<div class="language-bash highlighter-rouge"><div class="highlight"><pre class="highlight"><code><span class="nv">$ </span>podman tag &lt;image-id&gt; <span class="nv">$HOST</span>/openshift/forklift-controller:devel
<span class="nv">$ </span>podman push <span class="nv">$HOST</span>/openshift/forklift-controller:devel
</code></pre></div></div>

<p>Specifically, for forklift-controller this can be achieved with:</p>
<div class="language-bash highlighter-rouge"><div class="highlight"><pre class="highlight"><code><span class="nv">$ </span><span class="nb">export </span><span class="nv">IMG</span><span class="o">=</span><span class="nv">$HOST</span>/openshift/forklift-controller:devel
<span class="nv">$ </span>make push-controller
</code></pre></div></div>

<h1 id="redirect-the-pod-to-use-the-image-from-the-clusters-image-registry">Redirect the pod to use the image from the cluster’s image registry</h1>
<p>This part depends on the way the application is deployed, here I’ll describe a common practice for applications that are deployed using operators in which the image from the internal/cluster’s image registry is injected by the operator.</p>

<p>First, identify the ClusterServiceVersion instance in the relevant namespace (in my case it was called <code class="language-plaintext highlighter-rouge">mtv-operator.v2.3.1</code> in the <code class="language-plaintext highlighter-rouge">openshift-mtv</code> namespace).</p>

<p>Then, edit it and specify the image that was pushed to the internal registry, in my case it was done by editing <code class="language-plaintext highlighter-rouge">mtv-operator.v2.3.1</code>:</p>
<div class="language-bash highlighter-rouge"><div class="highlight"><pre class="highlight"><code><span class="nv">$ </span>oc edit csv <span class="nt">-n</span> openshift-mtv mtv-operator.v2.3.1
</code></pre></div></div>
<p>And setting the value of RELATED_IMAGE_CONTROLLER to: <code class="language-plaintext highlighter-rouge">image-registry.openshift-image-registry.svc:5000/openshift/forklift-controller:devel</code></p>

<p>Finally, delete the pod, in my case forklift-controller, so another one would start with the new image from the internal registry.</p>]]></content><author><name></name></author><summary type="html"><![CDATA[This post describes the next step in our journey to deploy MTV (Migration Toolkit for Virtualization) on Openshift Local: deploying a custom image to Openshift Local without going through an external registry like quay.io]]></summary></entry><entry><title type="html">Migrating from RHV to Openshift Local</title><link href="http://ahadas.com/mtv-on-openshift-local/" rel="alternate" type="text/html" title="Migrating from RHV to Openshift Local" /><published>2022-06-07T00:00:00+00:00</published><updated>2022-06-07T00:00:00+00:00</updated><id>http://ahadas.com/mtv-on-openshift-local</id><content type="html" xml:base="http://ahadas.com/mtv-on-openshift-local/"><![CDATA[<p>Recently I wanted to experience with <a href="https://github.com/konveyor/forklift">Forklift</a>, a project that enables to migrate virtual machines from Red Hat Virtualization (RHV) to Openshift Virtualization. Here, I’ll describe how I did this using Openshift Local which can be useful for development or experiments (Openshift Local is not meant for production use).</p>

<h1 id="prerequisits">Prerequisits</h1>

<p>We will need a bare-metal machine or a virtual machine with enough memory and CPU power. I used a virtual machine with 64G of RAM and 18 CPUs but I believe that even 32G of RAM and 10 CPUs would be enough. Additionally, as I won’t explain how to deploy RHV, I assume there is a RHV deployment that is accessible from within the machine that Openshift Local would run on.</p>

<h1 id="installing-openshift-local">Installing Openshift Local</h1>

<p>Installing Red Hat Openshift Local is really easy. There is a guide for how to do that on <a href="https://console.redhat.com/openshift/create/local">console.redhat.com</a>. 
Follow the instructions that appear there and make sure it ends successfully and you are able to login to the console with the credentials that appear at the end of the process.</p>

<h1 id="adjusting-openshift-local">Adjusting Openshift Local</h1>

<p>As we’re going to deploy both Openshift Virtualization and the Migration Toolkit for Virtualization on this cluster, we need to override the default settings of the cluster. First, we’ll increase the memory to 64G:</p>
<div class="language-bash highlighter-rouge"><div class="highlight"><pre class="highlight"><code><span class="nv">$ </span>crc config <span class="nb">set </span>memory 64000
</code></pre></div></div>
<p>Similarly, we’ll increase the number of CPUs to 16:</p>
<div class="language-bash highlighter-rouge"><div class="highlight"><pre class="highlight"><code><span class="nv">$ </span>crc config <span class="nb">set </span>cpus 16
</code></pre></div></div>

<p>For the previous settings to be applied and since we are now going to extend the virtual disk that is used by the virtual machine that runs the cluster, we need to stop the cluster:</p>
<div class="language-bash highlighter-rouge"><div class="highlight"><pre class="highlight"><code><span class="nv">$ </span>crc stop
</code></pre></div></div>
<p>Once it is stopped, we can extend the aforementioned virtual disk. I extended it by 40G:</p>
<div class="language-bash highlighter-rouge"><div class="highlight"><pre class="highlight"><code><span class="nv">$ </span>qemu-img resize ~/.crc/machines/crc/crc.qcow2 +40g
</code></pre></div></div>

<p>Before starting the Openshift cluster again, you can inspect the updated settings with:</p>
<div class="language-bash highlighter-rouge"><div class="highlight"><pre class="highlight"><code><span class="nv">$ </span>crc config view
</code></pre></div></div>
<p>If the settings look alright, start the Openshift cluster with:</p>
<div class="language-bash highlighter-rouge"><div class="highlight"><pre class="highlight"><code><span class="nv">$ </span>crc start
</code></pre></div></div>

<p>Next. we will extend the filesystem to consume the additional space. In order to do that, we need to log in to the virtual machine using:</p>
<div class="language-bash highlighter-rouge"><div class="highlight"><pre class="highlight"><code><span class="nv">$ </span>ssh <span class="nt">-i</span> ~/.crc/machines/crc/id_ecdsa <span class="nt">-o</span> <span class="nv">StrictHostKeyChecking</span><span class="o">=</span>no core@&lt;vm ip&gt;
</code></pre></div></div>
<p>You can find the IP address of the virtual machine with:</p>
<div class="language-bash highlighter-rouge"><div class="highlight"><pre class="highlight"><code><span class="nv">$ </span>crc ip
</code></pre></div></div>
<p>Once you’re inside the virtual machine, execute the following command:</p>
<div class="language-bash highlighter-rouge"><div class="highlight"><pre class="highlight"><code><span class="nv">$ </span>xfs_growfs /sysroot/
</code></pre></div></div>

<p>Congratulations, you now have an Openshift cluster with enough resources to run Openshift Virtualization and Migration Toolkit for Virtualization :)</p>

<h1 id="installing-openshift-virtualization">Installing Openshift Virtualization</h1>

<p>Go to the OperatorHub (Operators -&gt; OperatorHub) and search for ‘cnv’. You’ll get the Openshift Virtualization operator. Install it and make sure to have both hostpath-provisioner and kubevirt-hyperconverged at the end of the process.</p>

<h1 id="installing-migration-toolkit-for-virtualization">Installing Migration Toolkit for Virtualization</h1>

<p>Similarly, search for ‘mtv’ in the OperatorHub and install the Migration Toolkit for Virtualization Operator.</p>

<h1 id="setting-persistent-volumes">Setting persistent volumes</h1>

<p>Next, we will define a storage class that enables us to provision local persistent volumes (PVs) on the VM that runs the Openshift cluster. This is done by going to Storage-&gt;StorageClasses and create a new StorageClass. Give it a name and set the ‘Provisioner’ field to ‘kubevirt.io.hostpath-provisioner’.</p>

<p>Now we can change some of the built-in PVs to be consumable by this StorageClass. This is done by editing a PV, e.g., with ‘oc edit pv pv0009’ and set ‘accessModes’ to ‘ReadWriteOnce’ only and add ‘storageClassName: <storage-class-name>' within the 'spec'.</storage-class-name></p>

<p>You’re ready for your first migration!</p>

<h1 id="executing-a-migration-plan">Executing a migration plan</h1>

<p>In order to initiate a migration you first need to log in to the UI of the Migration Toolkit for Virtualization (MTV). You can find the URL in Networking -&gt; Routes and inspect the ‘Location’ of the ‘virt’ route within the openshift-mtv project (namespace). In my case it was ‘https://virt-openshift-mtv.apps-crc.testing’. Log in with the same credentials you used for the Openshift console.</p>

<p>Once you are logged in to the UI of MTV, add a RHV provider under ‘Providers’. You should find an Openshift Virtualization provider there as well.</p>

<p>Then, create mappings: go to ‘Mappings’ and define Network and Storage mapping from the source environment (RHV) to the target environment (Openshift Virtualization).</p>

<p>With that, you can now go to ‘Migration Plans’ and create a new migration plan. It is fairly simple to do by following the steps in that wizard. Assuming you chose a virtual machine(s) that is installed with a valid guest operating system, the execution of the migration plan would succeed and you’ll find the converted virtual machines within the ‘Virtualization -&gt; VirtualMachines’ view in the Openshift console.</p>]]></content><author><name></name></author><summary type="html"><![CDATA[Recently I wanted to experience with Forklift, a project that enables to migrate virtual machines from Red Hat Virtualization (RHV) to Openshift Virtualization. Here, I’ll describe how I did this using Openshift Local which can be useful for development or experiments (Openshift Local is not meant for production use).]]></summary></entry><entry><title type="html">Multi-Cluster Configuration with Kubernetes</title><link href="http://ahadas.com/multi-cluster-configurations/" rel="alternate" type="text/html" title="Multi-Cluster Configuration with Kubernetes" /><published>2020-07-04T00:00:00+00:00</published><updated>2020-07-04T00:00:00+00:00</updated><id>http://ahadas.com/multi-cluster-configurations</id><content type="html" xml:base="http://ahadas.com/multi-cluster-configurations/"><![CDATA[<p>Few months ago I’ve examined the ability to propagate configurations to Kubernetes clusters in a multi-cluster environment. Here I describe the process and tools in the hope that it will be useful for others that try to do the same thing.</p>

<h1 id="background">Background</h1>

<p>When we speak about configurations in the context of Kubernetes we typically speak about yaml files that describe how certain resources within the cluster should be defined. For instance, the configuration may include a URL that metrics should be sent to. As another example, the configuration may include all the properties of an application to be deployed to the cluster.</p>

<p>The GitOps paradigm promotes operating infrastructure using Git. A Git repository holds the state of the infrastructure and operators change the infrastructure using Git operations. For example, a property of one of the entities that comprise the infrastructure (e.g., a node) can be modified by modifying its corresponding resource within the Git repository (e.g., its labels). The GitOps paradigms becomes the common practice for managing the above mentioned configuration for Kubernetes.</p>

<p>Managing a single Kubernetes cluster using GitOps is relatively easy using tools like Argo CD. Argo CD, maybe the most popular tool for GitOps for Kubernetes nowadays, enables retrieving configuration from a bunch of sources (e.g., GitHub) and applying it to the cluster. The process is pretty straightforward: one needs to deploy Argo CD to the cluster and then define applications that retrieve configuration from a predefined Git repository and apply it to that cluster.</p>

<p>However, the process becomes more challenging in a multi-cluster environment.</p>

<h1 id="challenges-in-multi-cluster-environments">Challenges in Multi-Cluster Environments</h1>

<p>One of the hot topics in the Kubernetes world today is the management of multi-cluster environments. The <a href="https://github.com/openshift/hive">Openshift/Hive project</a> enables provisioning clusters as a service. <a href="https://www.redhat.com/en/technologies/management/advanced-cluster-management">Advanced Container Management (ACM)</a>, that was demonstrates in the last Red Hat summit, aims to facilitate various management operations (e.g., application delivery) in a multi-cluster environment.</p>

<p>When it comes to cluster configuration in a multi-cluster environment, several questions may arise:</p>
<ul>
  <li>How to propagate the configuration to the clusters? Do we want each cluster to pull its configuration from the Git repository or to propagate the configuration through a hub-cluster (or multiple hub-clusters)?</li>
  <li>Should all configurations get to all clusters or do we want to limit part of the configuration only to certain clusters?</li>
  <li>Do we need to alter the configuration with cluster-specific information (e.g., setting the name of the cluster on metrics that are reported from the cluster; or setting the URL of a hub-cluster that certain clusters should send their metrics to)?</li>
</ul>

<p>These questions, among others, may suggest that the aforementioned solution for a single-cluster might not be sufficient for a multi-cluster environment.</p>

<h1 id="argo-cd--openshithive">Argo CD + Openshit/Hive</h1>

<p>We have examined a multi-cluster solution that is based on Argo CD and Openshift/Hive. Conceptually, this solution is similar to the one that was <a href="https://assets.openshift.com/hubfs/Worldpay-fis-openshift-commons_COMMENTS.pptx.pdf">presented by Worldpay</a> to propagate configuration to Openshift clusters.</p>

<p>This solution assumes the system is composed of one or more hub-clusters and each hub-cluster manages one or more spoke/managed clusters. The spoke/managed clusters are provisioned by Openshift/Hive that runs on the hub-cluster. The configuration to propagate to the clusters resides in a remote Github repository. The next diagram depicts an example of such a system.</p>

<p><img src="../images/multi-cluster-conf/multi-cluster-gitops.png" alt="Multi-cluster environment" /></p>

<p>In our solution, Argo CD that is deployed to the hub-cluster is defined with an app(s) that retrieves the configuration from the remote Git repository. Then Argo CD pulls the configuration from the remote Git repository, transforms it into Openshift/Hive entities named SelectorSyncSets and finally, Openshift/Hive propagates the SelectorSyncSets to the spoke/managed clusters. The following diagram illustrates this process.</p>

<p><img src="../images/multi-cluster-conf/argo-hive.png" alt="Argo CD and Openshift/Hive" /></p>

<p>More specifically, we define several applications that are set to pull the configuration from a Git repository on GitHub. These applications are also configured with <a href="https://argoproj.github.io/argo-cd/operator-manual/custom_tools/">custom tools</a> that transform the pulled configuration into SelectorSyncSets. During the transformation variables within the original configuration can be replaced with details that are specific to a hub or spoke/managed cluster. By using SelectorSyncSets (rather than ordinary SyncSets), the configuration propagates to spoke/managed clusters based on their labels. The label-matching mechanism is the one that is commonly used by Kubernetes. The transformation code is available <a href="https://github.com/ahadas/syncset-gen">here</a>.</p>

<p>Using this mechanism we managed to deploy <a href="https://kubevirt.io/">KubeVirt</a>, <a href="https://github.com/openshift-kni/performance-addon-operators">Openshift-KNI/Performance-Addon-Operator</a>, and other Openshift configuration that requires adding and patching Kubernetes entities. The configurations we used are available <a href="https://github.com/danielerez/acm-gitops">here</a>. The beauty in this solution is that it does not rely on a central multi-cluster management application (but relies on provisioning the clusters using Openshift/Hive) and can work for a variety of configurations without having to deploy any additional component on the spoke/managed clusters. This mechanism is illustrated in more details in <a href="https://youtu.be/E4lJSd7Q874">this recording</a>.</p>

<h1 id="conclusion">Conclusion</h1>

<p>The described solution for configuration management in a multi-cluster Kubernetes-based environment appeared to be useful for propagating a variety of configurations to spoke/managed clusters in our evaluation. For various reasons, the ones that continued that work have decided to embrace alternative approaches. Yet, I think it might be handy for ones that look for a simple and lightweight solution that doesn’t involve a centralized management application.</p>]]></content><author><name></name></author><summary type="html"><![CDATA[Few months ago I’ve examined the ability to propagate configurations to Kubernetes clusters in a multi-cluster environment. Here I describe the process and tools in the hope that it will be useful for others that try to do the same thing.]]></summary></entry><entry><title type="html">Nightly Builds on GitHub using Jenkins</title><link href="http://ahadas.com/nightly-builds-jenkins-github/" rel="alternate" type="text/html" title="Nightly Builds on GitHub using Jenkins" /><published>2020-04-15T00:00:00+00:00</published><updated>2020-04-15T00:00:00+00:00</updated><id>http://ahadas.com/nightly-builds-jenkins-github</id><content type="html" xml:base="http://ahadas.com/nightly-builds-jenkins-github/"><![CDATA[<p>In this post I share a solution I have implemented for publishing nightly builds on GitHub.</p>

<h1 id="why-nightly-builds">Why Nightly Builds?</h1>

<p>Building and testing your project automatically is a common practice nowadays. Many projects run unit tests before merging pull requests (PRs). Some projects, like <a href="https://github.com/kubevirt">KubeVirt</a>, also run integration tests automatically before merging a PR, while others, like <a href="https://github.com/oVirt">oVirt</a>, run them on demand or after the fact. Various continuous integration tools such as <a href="https://travis-ci.com">Travis CI</a> and <a href="https://circleci.com">Circle CI</a> are available for this purpose.</p>

<p>However, many projects lack automatic releases. The concept of not only building the project but also deliverying unstable releases that are derived from the development branch periodically, possibly on a daily basis in which case they are generally referred to as <em>nightly builds</em>, is often missing despite its potential benefit. For users, it is a way to get exposed to new features and be able to provide early feedback. For developers, they may ease validating certain capabilities without the need to compile the code locally and then copy the artifacts elsewhere.</p>

<h1 id="whats-the-challenge">What’s the Challenge?</h1>

<p>In some projects, frequent packaging and deliverying of unstable releases may not be worthy due to various reasons. For instance, distributed infrastructure management systems may require relatively high amount of resources and complex installation process, and as such their users may want to avoid deploying unstable releases. As another example, users of mission-critical systems may wish to minimize the amount of changes in their system.</p>

<p>But I believe the reason for the lack of nightly builds for the majority of projects out there would rather be the lack of a proper place to store them. Nightly builds are clearly useful for most projects, especially for software that is delivered as-a-service (SaaS) or standalone applications, however, it is not easy to find a free place to store them in a way that they could be easily consumed by users.</p>

<p>Let’s look at the muCommander project, for example. Nightly builds, that were produced by Jenkins, used to be stored on a local virtual machine. It was then easy to publish them on the project’s website. However, the project no longer possesses a local machine that can be available all the time. Today, both our source code and our website are hosted on GitHub (and GitHub Pages) and while GitHub provides a place to store releases, it lacks a mechanism for storing nightly builds.</p>

<h1 id="our-solution">Our Solution</h1>

<p>The recently introduced solution for muCommander involves building the nightly builds using a local virtual machine (with Jenkins) that pushes the artifacts to GitHub. This way, the nightly builds are stored  “in the cloud”, i.e., on a remote infrastructure that provides better availability than a local machine along with our stable releases that are also stored on GitHub. In addition, the local VM is a safe place to store a token for GitHub that is required for pushing the artifacts. While the local VM may not be running all the time, it can be easily recovered in case of a problem (in the worst case scenario, no new builds are produced but the latest would still be available).</p>

<p>I found no integration between Jenkins and GitHub that I could use for pushing the nightly builds to GitHub though. As I have previously mentioned, GitHub does not offer an out-of-the-box mechanism for third party tools like Jenkins or other CI/CD tools for nightly builds. This required me to write the following script that is based on the one I have found <a href="https://medium.com/@systemglitch/continuous-integration-with-jenkins-and-github-release-814904e20776">here</a>:</p>

<div class="language-sh highlighter-rouge"><div class="highlight"><pre class="highlight"><code><span class="c"># Publish on github</span>
<span class="nb">echo</span> <span class="s2">"Publishing on Github..."</span>
<span class="nv">token</span><span class="o">=</span><span class="s2">"&lt;your-token&gt;"</span>
 
<span class="c"># Setup variables</span>
<span class="nv">api_endpoint</span><span class="o">=</span><span class="s2">"https://api.github.com/repos/mucommander/mucommander"</span>
<span class="nv">uploads_endpoint</span><span class="o">=</span><span class="s2">"https://uploads.github.com/repos/mucommander/mucommander"</span>
<span class="nv">tag</span><span class="o">=</span><span class="s2">"nightly"</span>
<span class="nv">name</span><span class="o">=</span><span class="s2">"Nightly"</span>
<span class="nv">artifact</span><span class="o">=</span><span class="si">$(</span><span class="nb">ls </span>build/distributions<span class="si">)</span>
<span class="nv">md5</span><span class="o">=</span><span class="si">$(</span><span class="nb">md5sum </span>build/distributions/<span class="nv">$artifact</span> | <span class="nb">awk</span> <span class="s1">'{print $1}'</span><span class="si">)</span>
<span class="nv">description</span><span class="o">=</span><span class="s2">"MD5:</span><span class="se">\n</span><span class="nv">$md5</span><span class="s2"> </span><span class="nv">$artifact</span><span class="s2">"</span>
<span class="nv">description</span><span class="o">=</span><span class="si">$(</span><span class="nb">echo</span> <span class="s2">"</span><span class="nv">$description</span><span class="s2">"</span> | <span class="nb">sed</span> <span class="nt">-z</span> <span class="s1">'s/\n/\\n/g'</span><span class="si">)</span> <span class="c"># Escape line breaks to prevent json parsing problems</span>
 
<span class="c"># Query the existing release</span>
<span class="nv">release</span><span class="o">=</span><span class="si">$(</span>curl <span class="nt">-XGET</span> <span class="nv">$api_endpoint</span>/releases/tags/<span class="nv">$tag</span><span class="si">)</span>
 
<span class="c"># Extract the id of the release from the response</span>
<span class="nb">id</span><span class="o">=</span><span class="si">$(</span><span class="nb">echo</span> <span class="s2">"</span><span class="nv">$release</span><span class="s2">"</span> | <span class="nb">sed</span> <span class="nt">-n</span> <span class="nt">-e</span> <span class="s1">'s/"id":\ \([0-9]\+\),/\1/p'</span> | <span class="nb">head</span> <span class="nt">-n</span> 1 | <span class="nb">sed</span> <span class="s1">'s/[[:blank:]]//g'</span><span class="si">)</span>
 
<span class="k">if</span> <span class="o">[</span> <span class="o">!</span> <span class="nt">-z</span> <span class="s2">"</span><span class="nv">$id</span><span class="s2">"</span> <span class="o">]</span><span class="p">;</span> <span class="k">then</span>
    <span class="c"># Deleting the existing release</span>
    curl <span class="nt">-XDELETE</span> <span class="nt">-H</span> <span class="s2">"Authorization:token </span><span class="nv">$token</span><span class="s2">"</span> <span class="nv">$api_endpoint</span>/releases/<span class="nv">$id</span>
<span class="k">fi</span>
 
<span class="c"># Delete the existing tag</span>
<span class="si">$(</span>curl <span class="nt">-XDELETE</span> <span class="nt">-H</span> <span class="s2">"Authorization:token </span><span class="nv">$token</span><span class="s2">"</span> <span class="nv">$api_endpoint</span>/git/refs/tags/<span class="nv">$tag</span><span class="si">)</span> <span class="o">||</span> <span class="nb">true</span>
 
<span class="c"># Create a release</span>
<span class="nv">release</span><span class="o">=</span><span class="si">$(</span>curl <span class="nt">-XPOST</span> <span class="nt">-H</span> <span class="s2">"Authorization:token </span><span class="nv">$token</span><span class="s2">"</span> <span class="nt">--data</span> <span class="s2">"{</span><span class="se">\"</span><span class="s2">tag_name</span><span class="se">\"</span><span class="s2">: </span><span class="se">\"</span><span class="nv">$tag</span><span class="se">\"</span><span class="s2">, </span><span class="se">\"</span><span class="s2">target_commitish</span><span class="se">\"</span><span class="s2">: </span><span class="se">\"</span><span class="s2">master</span><span class="se">\"</span><span class="s2">, </span><span class="se">\"</span><span class="s2">name</span><span class="se">\"</span><span class="s2">: </span><span class="se">\"</span><span class="nv">$name</span><span class="se">\"</span><span class="s2">, </span><span class="se">\"</span><span class="s2">body</span><span class="se">\"</span><span class="s2">: </span><span class="se">\"</span><span class="nv">$description</span><span class="se">\"</span><span class="s2">, </span><span class="se">\"</span><span class="s2">draft</span><span class="se">\"</span><span class="s2">: false, </span><span class="se">\"</span><span class="s2">prerelease</span><span class="se">\"</span><span class="s2">: true}"</span> <span class="nv">$api_endpoint</span>/releases<span class="si">)</span>
 
<span class="c"># Extract the id of the release from the creation response</span>
<span class="nb">id</span><span class="o">=</span><span class="si">$(</span><span class="nb">echo</span> <span class="s2">"</span><span class="nv">$release</span><span class="s2">"</span> | <span class="nb">sed</span> <span class="nt">-n</span> <span class="nt">-e</span> <span class="s1">'s/"id":\ \([0-9]\+\),/\1/p'</span> | <span class="nb">head</span> <span class="nt">-n</span> 1 | <span class="nb">sed</span> <span class="s1">'s/[[:blank:]]//g'</span><span class="si">)</span>
 
<span class="c"># Upload the artifact</span>
curl <span class="nt">-XPOST</span> <span class="nt">-H</span> <span class="s2">"Authorization:token </span><span class="nv">$token</span><span class="s2">"</span> <span class="nt">-H</span> <span class="s2">"Content-Type:application/octet-stream"</span> <span class="nt">--data-binary</span> @build/distributions/<span class="nv">$artifact</span> <span class="nv">$uploads_endpoint</span>/releases/<span class="nv">$id</span>/assets?name<span class="o">=</span><span class="nv">$artifact</span>
</code></pre></div></div>

<p>Let’s go over this script:<br />
First, we set our token for GitHub as explained in the above-mentioned post.<br />
Then we initialize some variables. The script makes use of the GitHub API and so the first two variables point to the endpoints of general API calls and upload calls for the <code class="language-plaintext highlighter-rouge">github.com/mucommander/mucommander</code> repository. The next two variables contain the name of the tag and the name of the release that the nightly build will be associated with. Next two variables contain the name of the artifact and its MD5 hash. Lastly, we set the description of the release to contain the MD5 hash and the name of the artifact.<br />
Next, we query the existing release that is associated with the aforementioned tag and get its identifier. If the identifier is not empty, it means an existing release of a nightly build exists and it is therefore removed.<br />
We then remove the existing tag, if it exists, so it will be recreated by the new release on top of the latest commit on the master branch.<br />
Finally, we create a new release with the above-mentioned tag, name and description, and set it as non-draft and pre-release. We then extract the identifier of the created release and use it to upload the artifact that was already built by Jenkins to that release.</p>

<h1 id="whats-next">What’s Next?</h1>

<p>With this mechanism, we can start publishing nightly builds in the hope that they will provide us with earlier feedback on the upcoming features in muCommander. The nightly builds would be found <a href="https://github.com/mucommander/mucommander/releases/tag/nightly">here</a>.</p>]]></content><author><name></name></author><summary type="html"><![CDATA[In this post I share a solution I have implemented for publishing nightly builds on GitHub.]]></summary></entry><entry><title type="html">Plain Kubernetes Cluster on Fedora 31</title><link href="http://ahadas.com/kubernetes-on-fedora-31/" rel="alternate" type="text/html" title="Plain Kubernetes Cluster on Fedora 31" /><published>2020-01-05T00:00:00+00:00</published><updated>2020-01-05T00:00:00+00:00</updated><id>http://ahadas.com/kubernetes-on-fedora-31</id><content type="html" xml:base="http://ahadas.com/kubernetes-on-fedora-31/"><![CDATA[<p>In this post I describe how to run a plain (vanilla) Kubernetes cluster that spreads across physical machines installed with Fedora 31.</p>

<p>Various projects, like the <a href="https://kubevirt.io/">Kubevirt project</a> that I’ve been involved in recently, introduce an automated way for initiating a Kubernetes cluster. In Kubevirt, for instance, there is a framework named <a href="https://github.com/kubevirt/kubevirtci">kubevirtci</a> that enables one to quickly spin up and destroy Kubernetes clusters for testing. The kubevirtci framework is composed of two parts. The first part initiates a cluster. The second part deploys Kubevirt on top of that cluster. I can say kubevirtci served me well during the time I developed Kubevirt and the scripts and configurations used by kubevirtci may be used by others to easily run Kubernetes or Openshift clusters across multiple virtual machines within a single physical machine.</p>

<p>However, as part of a new project I started to work on I needed to run Kubernetes clusters across distributed virtual machines (that can be considered physical machines on the same network) for which kubevirtci does not fit, and so following are the steps I’ve made that I share in the hope others that attempt to achieve the same thing would find it useful.</p>

<p>First, we need to install docker as explained <a href="https://linuxconfig.org/how-to-install-docker-on-fedora-31">in this guide</a>.</p>

<p>Then change the <code class="language-plaintext highlighter-rouge">cgroup-driver</code> of docker to be systemd by extending <code class="language-plaintext highlighter-rouge">ExecStart</code> in <code class="language-plaintext highlighter-rouge">/etc/systemd/system/multi-user.target.wants/docker.service</code> with:</p>
<div class="language-plaintext highlighter-rouge"><div class="highlight"><pre class="highlight"><code>--exec-opt native.cgroupdriver=systemd
</code></pre></div></div>

<p>The next step is following <a href="https://kubernetes.io/docs/setup/production-environment/tools/kubeadm/install-kubeadm/">this guide</a>, and specifically:</p>

<p>Add Kubernetes repository:</p>
<div class="language-bash highlighter-rouge"><div class="highlight"><pre class="highlight"><code><span class="nv">$ </span><span class="nb">cat</span> <span class="o">&lt;&lt;</span><span class="no">EOF</span><span class="sh"> &gt; /etc/yum.repos.d/kubernetes.repo
[kubernetes]
name=Kubernetes
baseurl=https://packages.cloud.google.com/yum/repos/kubernetes-el7-x86_64
enabled=1
gpgcheck=1
repo_gpgcheck=1
gpgkey=https://packages.cloud.google.com/yum/doc/yum-key.gpg https://packages.cloud.google.com/yum/doc/rpm-package-key.gpg
</span><span class="no">EOF
</span></code></pre></div></div>

<p>Disable SELinux:</p>
<div class="language-bash highlighter-rouge"><div class="highlight"><pre class="highlight"><code><span class="nv">$ </span><span class="nb">sed</span> <span class="nt">-i</span> <span class="s1">'s/^SELINUX=enforcing$/SELINUX=permissive/'</span> /etc/selinux/config
</code></pre></div></div>

<p>Disable swap in <code class="language-plaintext highlighter-rouge">/etc/fstab</code>.</p>

<p>Disable the firewall:</p>
<div class="language-bash highlighter-rouge"><div class="highlight"><pre class="highlight"><code><span class="nv">$ </span>systemctl disable firewalld
</code></pre></div></div>

<p>Install Kubernetes packages:</p>
<div class="language-bash highlighter-rouge"><div class="highlight"><pre class="highlight"><code><span class="nv">$ </span>yum <span class="nb">install</span> <span class="nt">-y</span> kubelet kubeadm kubectl <span class="nt">--disableexcludes</span><span class="o">=</span>kubernetes
</code></pre></div></div>

<p>Enable <code class="language-plaintext highlighter-rouge">kubelet</code>:</p>
<div class="language-bash highlighter-rouge"><div class="highlight"><pre class="highlight"><code><span class="nv">$ </span>systemctl <span class="nb">enable</span> <span class="nt">--now</span> kubelet
</code></pre></div></div>

<p>Ensure <code class="language-plaintext highlighter-rouge">net.bridge.bridge-nf-call-iptables</code> is set to 1 in your sysctl config:</p>
<div class="language-bash highlighter-rouge"><div class="highlight"><pre class="highlight"><code><span class="nv">$ </span>sysctl net.bridge.bridge-nf-call-iptables<span class="o">=</span>1
</code></pre></div></div>

<p>Install <code class="language-plaintext highlighter-rouge">kubernetes-cni</code>:</p>
<div class="language-bash highlighter-rouge"><div class="highlight"><pre class="highlight"><code><span class="nv">$ </span>dnf <span class="nb">install </span>kubernetes-cni
</code></pre></div></div>

<p>Reboot the machine:</p>
<div class="language-bash highlighter-rouge"><div class="highlight"><pre class="highlight"><code><span class="nv">$ </span>shutdown <span class="nt">-r</span> now
</code></pre></div></div>

<p>On the master node, run:</p>
<div class="language-bash highlighter-rouge"><div class="highlight"><pre class="highlight"><code><span class="nv">$ </span>kubeadm init
</code></pre></div></div>

<p>Then deploy <code class="language-plaintext highlighter-rouge">weave-net</code>:</p>
<div class="language-bash highlighter-rouge"><div class="highlight"><pre class="highlight"><code><span class="nv">$ </span>kubectl apply <span class="nt">-f</span> <span class="s2">"https://cloud.weave.works/k8s/net?k8s-version=</span><span class="si">$(</span>kubectl version | <span class="nb">base64</span> | <span class="nb">tr</span> <span class="nt">-d</span> <span class="s1">'\n'</span><span class="si">)</span><span class="s2">&amp;env.IPALLOC_RANGE=10.32.0.0/16"</span>
</code></pre></div></div>

<p>On the worker nodes run <code class="language-plaintext highlighter-rouge">kubeadm join</code> with the token that was returned by <code class="language-plaintext highlighter-rouge">kubeadm init</code> on the master node. This, as well as <code class="language-plaintext highlighter-rouge">kubeadm init</code> on the master node, can be reverted back with <code class="language-plaintext highlighter-rouge">kubeadm reset</code>.</p>

<p>To check your cluster is up and running, inspect the nodes by running on the master node:</p>
<div class="language-bash highlighter-rouge"><div class="highlight"><pre class="highlight"><code><span class="nv">$ </span>kubectl get nodes
</code></pre></div></div>

<p>And the pods:</p>
<div class="language-bash highlighter-rouge"><div class="highlight"><pre class="highlight"><code><span class="nv">$ </span>kubectl get pods <span class="nt">-n</span> kube-system
</code></pre></div></div>

<p>To inspect the logs of <code class="language-plaintext highlighter-rouge">kubelet</code>, run:</p>
<div class="language-bash highlighter-rouge"><div class="highlight"><pre class="highlight"><code><span class="nv">$ </span>journalctl <span class="nt">-ur</span> kubelet.service
</code></pre></div></div>]]></content><author><name></name></author><summary type="html"><![CDATA[In this post I describe how to run a plain (vanilla) Kubernetes cluster that spreads across physical machines installed with Fedora 31.]]></summary></entry><entry><title type="html">muCommander</title><link href="http://ahadas.com/about-mucommander/" rel="alternate" type="text/html" title="muCommander" /><published>2018-08-09T00:00:00+00:00</published><updated>2018-08-09T00:00:00+00:00</updated><id>http://ahadas.com/about-mucommander</id><content type="html" xml:base="http://ahadas.com/about-mucommander/"><![CDATA[<p>Ten years ago (2008) I submitted my first contribution to an open source project named <a href="http://www.mucommander.com">muCommander</a> that I maintain to this day. This post provides a short description of the project, recent changes we have made, challenges we are facing, and some future plans.</p>

<h1 id="what">What?</h1>
<p><em><strong>muCommander is a lightweight, cross-platform file manager with a dual-pane interface. It runs on any operating system with Java support (Mac OS X, Windows, Linux, *BSD, Solaris…).</strong></em></p>

<p>In other words, muCommander is a long-standing (since 2002) open-source (GPLv3) file manager with a dual-pane interface (similar to that of <a href="https://en.wikipedia.org/wiki/Norton_Commander">Norton Commander</a>) that can run on all the mainstream operating systems.</p>

<h1 id="why">Why?</h1>
<p>First and foremost, muCommander supports various file formats (e.g., ZIP) and protocols (e.g., SMB). It complements common built-in file managers with additional file formats, like 7z, and capabilities, like on-the-fly editing of ZIP files on Mac OS X. Moreover, it eliminates the need to set up protocol-specific clients, such as an FTP-client.</p>

<p>And not only that muCommander supports many file protocols but it also abstracts reads and writes with Java input/output streams. That way, reading from a remote file protocol and writing to another remote file protocol can be made very efficient. For instance, it can read files from an FTP server and write them to an SMB server without writing them to a temporary persistent location. That is done by reading a portion of the file from an input-stream connected to the FTP server and immediately write it to an output-stream connected to the SMB server.</p>

<p>These great capabilities are provided on all mainstream operating systems (OS). By having its core and most of its functionality written in Java, muCommander becomes cross-platform. Except for some OS-specific features that use native code (e.g., moving files to the trash), everything is implemented in the Java language. For developers it is significant as it conforms the principle of <em>write once, run anywhere</em>.</p>

<p>Another benefit of being implemented in Java is that muCommander can leverage the large variety of third-party client-side libraries for different file protocols.</p>

<h1 id="recent-changes">Recent changes</h1>
<p>Honestly, the <a href="https://github.com/mucommander/mucommander/pulse">project pulse</a> has not been that great recently. I will touch that later on. Nevertheless, some important changes were done.</p>

<h2 id="technical">Technical</h2>
<ul>
  <li>Converted the code repository to Git.</li>
  <li>Moved the project to <a href="https://github.com/mucommander">GitHub</a>.</li>
  <li>Replaced the build system with Gradle.</li>
  <li><a href="https://github.com/mucommander/mucommander/pull/158">Enable compiling the code with Java 9 and Java 10</a>.</li>
  <li>Manage translations in the <a href="https://translate.zanata.org/project/view/mucommander">Zanata platform</a>.</li>
  <li>Fixed various bugs.</li>
</ul>

<h2 id="communal">Communal</h2>
<ul>
  <li>Updated the <a href="http://www.mucommander.com">website</a>.</li>
  <li>Revived the <a href="https://twitter.com/mucommander">twitter account</a>.</li>
  <li>Use <a href="https://gitter.im/mucommander/Lobby">Gitter</a>.</li>
</ul>

<h1 id="challenges">Challenges</h1>
<p>Next, I describe the four major challenges I see at the moment that hinder the progress of the project.</p>

<h2 id="scaling-the-development-model">Scaling the development model</h2>
<p>From time to time we get some really nice contributions as well as issues that users report. However, we currently have a fairly large codebase that becomes hard to maintain by a single maintainer. That causes PRs and issues to occasionally wait relatively long time for getting attention.</p>

<h2 id="communicating-with-the-community">Communicating with the community</h2>
<p>The contributions we get and issues that are being filed are a good sign as they show that both developers and end-users are interested in and using muCommander.</p>

<p>We used to communicate with the developer and user communities by <a href="https://groups.google.com/d/forum/mucommander-dev">Google group</a>, <a href="http://mu-j.com/mucommander/forums/">Forum</a>, and <a href="irc://irc.freenode.net/mucommander">IRC channel</a>. All these are practically abandoned. Seems like both the GitHub issues/PRs and Gitter provide good alternatives for communicating with developers. It may feel like the tools we currently use do not provide a good alternative to the Google group and the Forum for getting feedback and ideas from users though. But on the other hand, that may also be a consequence of the relatively low traffic in general in the project these days.</p>

<h2 id="competitive-products-and-projects">Competitive products and projects</h2>
<p>There is a large variety of alternative file managers nowadays. Some of them target a specific operating system and thus are sometimes faster and better integrated (the most interesting are probably those that target Mac OS X, that is used by most of our user base). Some are backed up by commercial organizations. Those are typically proprietary products that provide base funtionality for free  and other paid capabilities.</p>

<p>Another type of alternative products are those that have forked from muCommander in the past. Some forks that we have made contact with complained about the development pace of the project that they claim is too slow. That is a shame since migrating features from these forks to muCommander is not always trivial and it could have been much more productive to join forces in a single project.</p>

<h2 id="technical-debts">Technical debts</h2>
<p>Some features that were recently introduced exposed gaps in our application. Here, I describe two of them:</p>

<ol>
  <li>As mentioned before, muCommander was designed to be a <strong>lightweight</strong> file manager, something one can deploy on a minimal USB stick and execute on different machines. That is why we use <em>proguard</em> to shrink the jar that is being produced. Nontheless, the size of the produced jar increased due to features such as <a href="https://yuval.kohavi.info/vsphere/">supporting vSphere VMs file system</a> that brought with it a dependency of size 3.3M.</li>
  <li>When considering something like supporting the qcow2 volumes format (and other virtual disk formats, such as vmdk) using libguestfs, we encounter two issues. First, libguestfs is not available on all operating systems. As mentioned before, muCommander already includes OS-specific things but in this case it would mean having unused dependencies on many operating systems. Second, it requires not only the java dependency (java bindings for libguestfs) but also library code to be installed on the OS (libguestfs). We currently have no way to specify such dependencies.</li>
</ol>

<h1 id="so-what-should-we-do">So what should we do?</h1>
<p>Next, I will share some thoughts on how to address the aforementioned challenges.</p>

<h2 id="redefine-the-mission-statement">Redefine the “mission statement”</h2>
<p>The development of muCommander started more than 15 years ago. That is a pretty long time in software terms and so some of the assumptions we began with may not be relevant anymore. For example, the minimal USB stick today contains at least 1G and internet connection is much faster. So considering that muCommander is unlikely to run on devices with limited resources (such as mobile phones), it would probably be alright to produce a larger-size application. As another example, today much more data is stored on cloud services such as dropbox and google drive. Supporting such services may be more important for end-users than things like an advanced integrated text editor nowadays.</p>

<p>So I think this may be the right time to reconsider what is the goal of muCommander - what are its strengths, what should it provide, why should users continue using it and why should developers continue contributing to it.</p>

<h2 id="pluggable-design">Pluggable design</h2>
<p>In my opinion, the most important technical change at the moment is introducing a pluggable framework. First, it can target only extensions for new file formats and file protocols. Later, it can be extended with other types of extensions.</p>

<p>Such a pluggable framework would enable us to:</p>

<ul>
  <li>Separate out heavy file format or protocol implementations from the codebase.</li>
  <li>Install OS-specific extensions only when they are needed.</li>
  <li>Define external dependencies per-extension.</li>
</ul>

<p>The implementation of a pluggable machnism for muCommander <a href="https://groups.google.com/d/msg/mucommander-dev/-IfxXALXo4U/CJKrhA6A1aYJ">was already discussed in the past</a>. A natural infrastructure to use for this would be OSGI.</p>

<h2 id="promoting-the-project">Promoting the project</h2>
<p>With an up-to-date “mission statement” and a pluggable framework available, we should then promote the project. There are several ways to do this, like:</p>

<ul>
  <li>Presenting in a conference, such as FOSDEM or DevConf.cz.</li>
  <li>Writing an article to a known website, such as <a href="https://opensource.com">opensource.com</a>.</li>
  <li>Defining a list of some desired features (such as PDF viewer, integrating dagger 2, etc) and submitting the project to GSoC (Google Summer of Code).</li>
</ul>

<h2 id="reassess-gitter-for-user-discussions">Reassess Gitter for user discussions</h2>
<p>When things are back on track, we can reassess Gitter as a tool for communicating with end-users. It may be a good idea to schedule a bi-weekly (or a monthly) conference meeting to discuss topics related to the project.</p>]]></content><author><name></name></author><summary type="html"><![CDATA[Ten years ago (2008) I submitted my first contribution to an open source project named muCommander that I maintain to this day. This post provides a short description of the project, recent changes we have made, challenges we are facing, and some future plans.]]></summary></entry><entry><title type="html">Addressing Abstraction Hell in oVirt</title><link href="http://ahadas.com/engine-xml/" rel="alternate" type="text/html" title="Addressing Abstraction Hell in oVirt" /><published>2017-11-01T00:00:00+00:00</published><updated>2017-11-01T00:00:00+00:00</updated><id>http://ahadas.com/engine-xml</id><content type="html" xml:base="http://ahadas.com/engine-xml/"><![CDATA[<p>When I was a kid we used to play this game in which someone thought about a message and told it to his friend. The latter told the message he heard to another kid, and so on. Eventually, we were amused to see the difference between the original message and the one that the last kid has heard. This post describes our approach for addressing a similar problem that was caused by having too many abstraction layers in oVirt. Each layer converted its input in order to report it to the next layer “in its own words”, resulting in cumbersome and error-prone business flows in our platform.</p>

<h1 id="background">Background</h1>
<p>oVirt was originated from a management platform developed by a <a href="https://en.wikipedia.org/wiki/Qumranet">startup company that created the KVM hypervisor</a>. Back at its early days, not only that the technology it was implemented in was different than the one we use today, but it was also designed differently.</p>

<p>Initially, the agent that resides on the distributed hosts, VDSM, was expected to interact directly with the hypervisor. Another protocol was defined for the communication between the central management unit (called ovirt-engine nowadays) and VDSM.</p>

<p>Consequently, flows that included interaction with the hypervisor required two data conversions. Figure 1 depicts such a flow. The management unit had its own representation of business entities that front-end clients used in order to communicate with the back-end. The management unit needed to convert those entities to the language VDSM speaks which is dictionary-based. VDSM, in turn, needed to convert the dictionary it received to the set of parameters that conform with the language of the hypervisor.</p>

<p><img src="../images/engine_xml/without_libvirt.png" alt="Architecture Before Using Libvirt" /><br />
Figure 1: Architecture Before Using Libvirt</p>

<p>Later, Libvirt got into the picture. Libvirt provides an API for managing virtualization hosts. Its API is the de-facto standard in the industry, supporting a variety of hypervisors such as hyperv, xen, esx and qemu. Although focusing on qemu-kvm, it was a natural decision to leverage that simpler, more general and widely supported API in oVirt despite the downsides in having yet-another-abstraction-layer.</p>

<h1 id="problem">Problem</h1>

<p>And so, an additional layer was added. Figure 2 depicts the previously mentioned flow with that new design. Now, VDSM converts its input into the language that Libvirt speaks (that is mostly XML-based) and Libvirt converts that to the language of the hypervisor.</p>

<p><img src="../images/engine_xml/with-libvirt.png" alt="Architecture with Libvirt" /><br />
Figure 2: Architecture with Libvirt</p>

<p>Since Libvirt is treated as a third-party tool in oVirt, we remained with two conversions in the scope of our platform. First, ovirt-engine converts its business entities into a dictionary. Second, VDSM converts the dictionary into Libvirt’s XMLs.</p>

<p>The need to convert data twice, in two different components, introduced several challenges. First, it required one to code in two different programming languages, as ovirt-engine is written in Java while VDSM is written in Python. In practice, many times several developers were involved in every feature, each was responsible for a part of the implementation within a certain component. These developers had to always be in-sync. Second, flows were more buggy and harder to debug as more code that is spread over different repositories and deployed in different places was required. Third, and maybe most importantly, the development process required reviews by different people that maintain the different components. It generally reduced the pace of the development process, mainly due to the review process in VDSM that has traditionally been slower largely due to its maintainership model.</p>

<h1 id="approach">Approach</h1>
<p>We observed that many of our features required changes on the client side, UI or REST-API based clients, as well as on the back-end side but only minimal changes were needed on the agent side. The latter part mostly included conversion of data into Libvirt’s XMLs.</p>

<p>Thus, by letting ovirt-engine speak the language of Libvirt rather than that of VDSM, i.e., converting its business entities directly to Libvirt’s XMLs, not only that we use a more standard API in ovirt-engine but we often avoid any change in VDSM. Furthermore, this reduces the chances of people making hacks on the host side and increases the chances of the data representation in ovirt-engine being better aligned with the one in Libvirt.</p>

<h1 id="implementation">Implementation</h1>
<p>We modified ovirt-engine to both generate Libvirt’s Domain XML on run VM and to consume Libvirt’s Domain XML when monitoring the devices of the VM.</p>

<p>In run VM flow (figure 3), ovirt-engine now generates a full Libvirt’s Domain XML. Since the dictionary used to contain data that is required for VDSM but is not included in the specification of the Domain XML, the XML is extended with a metadata section that contains this kind of data. VDSM in turn inspects the metadata section to gather the information it needs for preparing the host for running the VM (e.g., creates payload devices, activates LVs) and then passes the XML to Libvirt.</p>

<p><img src="../images/engine_xml/run_vm.png" alt="Run VM Flow" /><br />
Figure 3: Run VM Flow</p>

<p>In the monitoring process (figure 4), ovirt-engine now queries the Domain XML of the running VMs whose devices hash has changed. Then, ovirt-engine matches the reported devices with the ones in the database, the kind of matching that VDSM used to do, and passes the reported devices along with their correlation with the devices that exist in the database as a dictionary to the legacy devices monitoring code. This is done in a conversion layer (class) that was added to ovirt-engine.</p>

<p><img src="../images/engine_xml/devices_monitoring.png" alt="VM Devices Monitoring Flow" /><br />
Figure 4: VM Devices Monitoring Flow</p>

<h1 id="summary">Summary</h1>
<p>In oVirt 4.2 we made a major change behind the scenes in the way ovirt-engine and VDSM interact. Now, ovirt-engine uses the commonly used API of Libvirt and VDSM mostly routes data from/to Libvirt in virt (i.e., VM-lifecycle) flows. This way, we eliminate the costly conversion of the data (in terms of development effort) by VDSM in these flows.</p>

<p>This change is supposed to be invisible for most of our users. However, while debugging issues that involve running a VM, one should be aware that the Domain XML is now generated by ovirt-engine and is printed to engine.log. In addition, while debugging issues with devices monitoring, one should now be aware that ovirt-engine matches the reported devices with the ones from the database rather than VDSM.</p>

<p>We have already been able to add new functionality to oVirt 4.2 more easily with this change and we expect it to also simplify future changes.</p>]]></content><author><name></name></author><summary type="html"><![CDATA[When I was a kid we used to play this game in which someone thought about a message and told it to his friend. The latter told the message he heard to another kid, and so on. Eventually, we were amused to see the difference between the original message and the one that the last kid has heard. This post describes our approach for addressing a similar problem that was caused by having too many abstraction layers in oVirt. Each layer converted its input in order to report it to the next layer “in its own words”, resulting in cumbersome and error-prone business flows in our platform.]]></summary></entry><entry><title type="html">External DSL for API Specification in oVirt</title><link href="http://ahadas.com/dsl-for-api-spec-in-ovirt/" rel="alternate" type="text/html" title="External DSL for API Specification in oVirt" /><published>2016-10-19T00:00:00+00:00</published><updated>2016-10-19T00:00:00+00:00</updated><id>http://ahadas.com/dsl-for-api-spec-in-ovirt</id><content type="html" xml:base="http://ahadas.com/dsl-for-api-spec-in-ovirt/"><![CDATA[<p>Few weeks ago I attended a session on the new API specification in oVirt. While the motivation was well explained and the overall design of the solution made a lot of sense, the presented language made me wonder whether it is the best <em>language</em> for the problem at hand. In this post I argue we can achieve a better language for the API specification in oVirt by using an external DSL rather than an internal DSL.</p>

<h1 id="background">Background</h1>
<p>Let’s start with a brief overview of what domain-specific languages are, the difference between internal and external domain-specific languages and describe tools that are available today for creating and using external domain-specific languages.</p>

<h2 id="domain-specific-language">Domain Specific Language</h2>
<p>A domain specific language (DSL) is a programming language that is tailored to a particular problem domain. Unlike general purpose languages (such as Java, C, C#), DSLs do not aim at being turing-complete. They generally provide syntax that is more declarative, concise and restrictive at the expense of reusability.</p>

<p>The concept of DSLs is not new. Most probably, if you are a developer you have already programmed with a DSL. Some notable examples of DSLs are: HTML for creating webpages, SQL for interaction with databases and MATLAB for matrix programming.</p>

<h2 id="internal-vs-external-dsl">Internal vs External DSL</h2>
<p>Martin Fowler <a href="http://martinfowler.com/books/dsl.html">distinguishes between two types of DSLs</a>: internal and external. An internal DSL is a particular form of API in a general purpose host language (e.g., fluent API), while an external DSL is parsed independently and is not a part of a host language.</p>

<p>There is a clear trade-off between using internal and external DSLs. On the one hand, it is generally easier to create internal DSLs since one can leverage the parser and compilation tools of the host language. Moreover, one can leverage editing tools intended for the host language while programming with the internal DSL. On the other hand, internal DSLs are limited by the syntax and structure of the host language, which often results in more complicated languages to program with compared to external DSLs.</p>

<h2 id="language-workbench">Language Workbench</h2>
<p>Fowler noted language workbenches (LWs) as a possible <a href="http://www.martinfowler.com/articles/languageWorkbench.html">killer-app for DSLs</a>. These are tools that address the Achilles’ heel of external DSLs by facilitating their creation and use.</p>

<p>Today, LWs are typically based on mainstream IDEs and provide one with tool support for the grammar definition of the DSL using some grammar definition format (from which the parser and editing tools are generated) and tool support for the definition of the semantics of the DSL using some code transformation format (so DSL code could be transformed into code in a general purpose language in order to leverage the compilation tools of the latter).</p>

<p>Some notable production-ready language workbenches that are available today are: <a href="http://www.eclipse.org/Xtext/">Xtext</a> and <a href="http://metaborg.org">Spoofax</a> that are based on Eclipse, and <a href="https://www.jetbrains.com/mps/">MPS</a> that is based on IntelliJ. I find Xtext to be the most practical LW nowadays among the ones mentioned above thanks to its ability to generate plugins for programming with the DSL in both Eclipse and IntelliJ, the <a href="https://eclipse.org/Xtext/documentation/305_xbase.html">integration one can achieve with Java</a> and the fact that it does not make use of <a href="http://martinfowler.com/bliki/ProjectionalEditing.html">projectional editing</a>.</p>

<h1 id="problem">Problem</h1>
<p>A problem we were trying to solve in oVirt 4.0 was twofold:</p>

<h2 id="dependencies">Dependencies</h2>
<p>oVirt provides several software development kits (SDKs) for different languages: Java, Python and recently also for Ruby. These SDKs interact with oVirt-engine, the central management unit, through REST-API interface.</p>

<p>Previously, the specification of the REST-API interface was integrated in the oVirt-engine project (figure 1). That lead to two issues. First, SDKs were depended on a fat artifact that contained more than just the specification. Second, we could publish this artifact only when a new version of oVirt-engine was released.</p>

<p><img src="../images/ovirt_api/ovirt-api-arch-before.png" alt="Architecture with oVirt API v3" /><br />
Figure 1: Architecture with oVirt API v3</p>

<h2 id="documentation">Documentation</h2>
<p>While it was possible to document the specification on top of the Java implementation of the REST-API interface using Javadoc, many parts were missing or not up-to-date.</p>

<h1 id="current-solution-based-on-internal-dsl">Current Solution based on Internal DSL</h1>
<p>The solution that was presented in version 4 of the API consisted of two parts. First, there was an architectural design change. The specification of the API was extracted into a separate project. The use of a separate project with its own source code repository allows other projects, like the SDKs, to depend only on the specification artifact (figure 2) and allows to publish new versions of the API specification independently. This solves the first part of the problem related to dependencies.</p>

<p><img src="../images/ovirt_api/ovirt-api-arch-after.png" alt="Architecture with oVirt API v4" /><br />
Figure 2: Architecture with oVirt API v4</p>

<p>Second, a new language was introduced to express the API specification in order to ease its documentation. This language is an internal DSL with Java as the host language.</p>

<p>In this language data types are represented by Java interfaces and documentation is provided in the form of Javadoc comment. For example, the <code class="language-plaintext highlighter-rouge">Vm.java</code> file contains the specification of the <code class="language-plaintext highlighter-rouge">Vm</code> entity, which looks like this:</p>

<div class="language-java highlighter-rouge"><div class="highlight"><pre class="highlight"><code><span class="cm">/**
 * Represents a virtual machine.
 */</span>
<span class="nd">@Type</span>
<span class="kd">public</span> <span class="kd">interface</span> <span class="nc">Vm</span> <span class="kd">extends</span> <span class="nc">VmBase</span> <span class="o">{</span>
   <span class="cm">/**
     * Contains the reason why this virtual machine was stopped. This reason is
     * provided by the user, via the GUI or via the API.
     */</span>
    <span class="nc">String</span> <span class="nf">stopReason</span><span class="o">();</span>
    <span class="nc">Date</span> <span class="nf">startTime</span><span class="o">();</span>
    <span class="nc">Date</span> <span class="nf">stopTime</span><span class="o">();</span>
    <span class="o">...</span>
<span class="o">}</span>
</code></pre></div></div>
<p>Services are represented in a similar way:</p>

<div class="language-java highlighter-rouge"><div class="highlight"><pre class="highlight"><code><span class="cm">/**
 * This service manages a specific virtual machine.
 */</span>
<span class="nd">@Service</span>
<span class="kd">public</span> <span class="kd">interface</span> <span class="nc">VmService</span> <span class="kd">extends</span> <span class="nc">MeasurableService</span> <span class="o">{</span>

    <span class="cm">/**
     * This operation will start the virtual machine managed by this
     * service, if it isn't already running.
     */</span>
    <span class="kd">interface</span> <span class="nc">Start</span> <span class="o">{</span>
        <span class="cm">/**
         * Specifies if the virtual machine should be started in pause
         * mode. It is an optional parameter, if not given then the
         * virtual machine will be started normally.
         */</span>
        <span class="nd">@In</span> <span class="nc">Boolean</span> <span class="nf">pause</span><span class="o">();</span>
        <span class="o">...</span>
    <span class="o">}</span>
    <span class="o">...</span>
<span class="o">}</span>
</code></pre></div></div>

<p>More about the current language can be found <a href="https://github.com/oVirt/ovirt-engine-api-model/blob/master/README.adoc">here</a>.</p>

<h1 id="enhanced-solution-with-external-dsl">Enhanced Solution with External DSL</h1>
<p>The solution proposed in this post leaves the first part, the architectural design change, as is. That is, the API specification stays as a separate project. The difference is in the second part, namely the language introduced for the API specification, where an external DSL is used rather than an internal DSL.</p>

<p>An example for how to define the <code class="language-plaintext highlighter-rouge">VM</code> entity mentioned before with an external DSL:</p>

<div class="language-plaintext highlighter-rouge"><div class="highlight"><pre class="highlight"><code>'Represents a virtual machine.'
Type Vm : VmBase {
'Contains the reason why this virtual machine was stopped.
 This reason is provided by the user, via the GUI or via the API'
stopReason :: String;

TODO
startTime :: Date;

TODO
stopTime :: Date;
...
}
</code></pre></div></div>

<p>And <code class="language-plaintext highlighter-rouge">VmService</code> can be defined like this:</p>

<div class="language-plaintext highlighter-rouge"><div class="highlight"><pre class="highlight"><code>"This service manages a specific virtual machine."
Service VmService : MeasurableService {
"This operation will start the virtual machine managed by
 this service, if it isn't already running."
Start {
"Specifies if the virtual machine should be started in pause
 mode. It is an optional parameter, if not given then the
 virtual machine will be started normally."
In paused :: Boolean;
}
...
}
</code></pre></div></div>

<p>
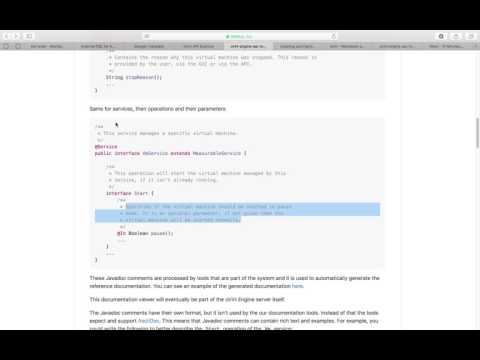
These code quotes could make you underestimate the effectiveness of programming with such a language due to the lack of support by Github’s markdown format for the presented language. IDE plugins, in contrast, provide the developer with the standard editing tools that are available today like auto-completion and text-highlighting. The next video demonstrates how a part of the <code class="language-plaintext highlighter-rouge">VmService</code> shown above was written in Eclipse:</p>

<p><a href="http://www.youtube.com/watch?feature=player_embedded&amp;v=PQgsuF9CvOQ" target="_blank"><img src="http://img.youtube.com/vi/PQgsuF9CvOQ/0.jpg" alt="Developing a DSAL for synchronization in oVirt" width="240" height="180" border="10" /></a></p>

<p>The language definition can be found <a href="https://github.com/ahadas/ovirt-engine-api-lang/blob/master/org.ovirt.api.model/src/org/ovirt/api/model/Spec.xtext">here</a>. The language is defined in the grammar definition format provided by Xtext. For more details about this format and Xtext in general see <a href="https://eclipse.org/Xtext/documentation/index.html">the documentation on eclipse.org</a>.</p>

<p>As a proof of concept, the <code class="language-plaintext highlighter-rouge">Vm</code> entity and <code class="language-plaintext highlighter-rouge">VmService</code> were transformed into their implementation in the internal DSL shown before. This transformation that was written in Xtend, a programming language provided by Xtext, can be found <a href="https://github.com/ahadas/ovirt-engine-api-lang/blob/master/org.ovirt.api.model/src/org/ovirt/api/model/generator/SpecGenerator.xtend">here</a>. Note that in production it would be better to transform them directly into the target representation of the specification without the transformation into the internal DSL. The full definition of <code class="language-plaintext highlighter-rouge">Vm</code> and <code class="language-plaintext highlighter-rouge">VmService</code> can be found <a href="https://github.com/ahadas/ovirt-engine-api-model/blob/master/ovirt-engine-api-model/src/Vm.ospec">here</a> and <a href="https://github.com/ahadas/ovirt-engine-api-model/blob/master/ovirt-engine-api-model/src/VmService.ospec">here</a> (and the generated code <a href="https://github.com/ahadas/ovirt-engine-api-model/blob/master/ovirt-engine-api-model/src-gen/types/Vm.java">here</a> and <a href="https://github.com/ahadas/ovirt-engine-api-model/blob/master/ovirt-engine-api-model/src-gen/services/VmService.java">here</a>).</p>

<h1 id="why-is-external-dsl-better">Why is External DSL Better</h1>
<p>So what is the big deal between using the internal DSL vs. using the external DSL you may ask. Their syntax is quite similar and the latter does not provide one with the ability to express something one cannot express with the former. I will point out the benefits of using an external DSL by addressing things that came up in the session I mentioned at the beginning and from my own experience with working with both languages.</p>

<p>The argument for basing the presented language on Java (which makes it an internal DSL) was to make it possible to leverage Java tools. But as we have seen before, the same capabilities can also be achieved for an external DSL by using a language workbench.</p>

<p>In the mentioned session one asked whether the language itself or the tools developed for it (for its transformation I believe) can be reused by other projects. The answer was positive. Questions about reuse are often raised in order to find a way to reduce the amortized development cost. However, when using a proper language workbench, one uses third-party tools for the language definition and its transformation that significantly simplify the language development, making it (typically) cost-effective even for one-time use. By taking reusability out of the equation, the language can be kept minimal and optimal for the particular instance of the problem at hand.</p>

<p>The presenter showed an example for adding a color to the <code class="language-plaintext highlighter-rouge">Vm</code> entity. One guy asked if we can use the type <code class="language-plaintext highlighter-rouge">byte</code> for the RGB values of the color instead of an <code class="language-plaintext highlighter-rouge">int</code>. The answer was negative. This is an example of a downside of basing the language on Java - one may try to use any type provided by Java, even unexpected ones. In contrast, the external DSL provides only the supported types. Note: yet, one can easily define that a particular field can be of any Java type, if needed.</p>

<p>That example exposed another downside of the internal DSL. The presenter typed most of the definition of the color without specifying a comment for that field. Then he asked “is something missing?” and although that question seemed suspicious, most of the crowd answered that nothing is missing. Documentation in the form of Javadoc is optional and is easy to forget. The fact that documentation in the internal DSL is provided as Javadoc could make one reach the code review phase without the required documentation and the reviewer can easily miss it. In the external DSL, however, documentation is part of the language and thus lack of documentation will produce an error by the IDE (without any checkstyle or other plugin), making it impossible to forget to document.</p>

<p>Another question was: why should we use the <code class="language-plaintext highlighter-rouge">@Type</code> and <code class="language-plaintext highlighter-rouge">@Service</code> annotations while we can retrieve that information from the package the file is located in (either <code class="language-plaintext highlighter-rouge">types</code> or <code class="language-plaintext highlighter-rouge">services</code>)? I think this question can be generalized to: how can we reduce the boilerplate code? Looking at code written in the internal DSL, we see a redundant syntax that is repeated again and again: the visibility of the types and services, the <code class="language-plaintext highlighter-rouge">interface</code> keyword near every action in a service, empty parenthesis near every property of a data type and so on. In contrast, we see much less boilerplate code in one written in the external DSL.</p>

<p>Moreover, having the language less coupled with Java makes it easier to work with for non-programmers. Typically, ones that mainly work on documentation are not programmers. Simplifying the grammar and making it more declarative (specifically the documentation part as we will discuss next) makes it easier for them to contribute.</p>

<p>And lastly, besides being optional, the fact that Javadoc comments have no clear structure makes it difficult to understand the expected format of the documentation. For example, one is expected to write the date and status of a comment he adds/modifies. It is easy to forget to write the date and unless the reviewer catches it, documentation can be merged without specifying its date or when it is typed incorrectly (having @data instead of @date for instance). As for the status, not only that it is easy to forget to specify it, it is unclear what are its allowed values since it is a free text. Unlike the internal DSL, the external DSL provides a clear structure for documentation as part of the language, enforcing developers to provide all the required values and reduce the chance for issues that are caused by typos. An example for a structured documentation in the external DSL:</p>

<div class="language-plaintext highlighter-rouge"><div class="highlight"><pre class="highlight"><code>summary: 'This operation stops any migration of a virtual machine to another physical host.'
description: '
[source]
----
POST /ovirt-engine/api/vms/123/cancelmigration
----

The cancel migration action does not take any action specific parameters,
so the request body should contain an empty `action`:

[source,xml]
----
&lt;action/&gt;
----
'
author: 'Arik Hadas &lt;ahadas@redhat.com&gt;'
date: '14 Sep 2016'
status: added
CancelMigration {
 'Indicates if the migration should cancelled asynchronously.'
 In async :: Boolean; 
}
</code></pre></div></div>

<p>One downside of using an external DSL is that it means to require contributors to use an IDE plugin for programming with the external DSL. On the other hand, language workbenches like Xtext are able to produce plugins for mainstream IDEs and mechanisms like Eclipse’s update-site can simplify the installation of such plugins.</p>

<h1 id="conclusion">Conclusion</h1>
<p>The advanced language workbenches that are available today greatly increase the attractiveness of external DSLs. One is able to program with languages that typically better fit for the problems at hand compared to general purpose languages and internal DSLs without the high effort that was traditionally needed in order to create them and program with them due to lack of tools.</p>

<p>This post presents an external DSL for the API specification of oVirt that was partially implemented using the Xtext language workbench. Hopefully this post would interest people that work on oVirt’s API specification and push them toward giving a chance for such a language instead of the internal DSL that was introduced in oVirt 4.0.</p>]]></content><author><name></name></author><summary type="html"><![CDATA[Few weeks ago I attended a session on the new API specification in oVirt. While the motivation was well explained and the overall design of the solution made a lot of sense, the presented language made me wonder whether it is the best language for the problem at hand. In this post I argue we can achieve a better language for the API specification in oVirt by using an external DSL rather than an internal DSL.]]></summary></entry><entry><title type="html">Monitoring Improvements in oVirt</title><link href="http://ahadas.com/monitoring-improvements-in-ovirt/" rel="alternate" type="text/html" title="Monitoring Improvements in oVirt" /><published>2016-07-24T00:00:00+00:00</published><updated>2016-07-24T00:00:00+00:00</updated><id>http://ahadas.com/monitoring-improvements-in-ovirt</id><content type="html" xml:base="http://ahadas.com/monitoring-improvements-in-ovirt/"><![CDATA[<p>Recently I’ve been working on improving the scalability of monitoring in oVirt. That is, how to make oVirt-engine, the central management unit in the oVirt management system, able to process and report changes in a growing number of virtual machines that are running in a data-center. In this post I elaborate on what we did and share some measurements.</p>

<h1 id="background">Background</h1>

<h2 id="monitoring-in-ovirt">Monitoring in oVirt</h2>
<p>In short, <a href="http://ovirt.org">oVirt</a> is an open-source management platform for virtual data-centers. It allows centralized management of a distributed system of virtual machines, compute, storage and networking resources.</p>

<p>In this post the term <em>monitoring</em> refers to the mechanism that oVirt-engine, the central component in the oVirt distributed system, collects runtime data from hosts that virtual machines are running on and reports it to clients. Some examples of such runtime data:</p>

<ul>
  <li>Statuses of hosts and VMs</li>
  <li>Statistics such as memory and cpu consumption</li>
  <li>Information about devices that are attached to VMs and hosts</li>
</ul>

<h2 id="notable-changes-in-the-monitoring-code-in-the-past">Notable changes in the monitoring code in the past</h2>

<h3 id="unchangablebyvdsm">@UnchangableByVdsm</h3>
<p>Generally speaking, the monitoring gets runtime data reported from the hosts, compares it with the previously known data and process the changes.<br />
In order to distinguish dynamic data that is reported by the hosts and dynamic data that is not reported by the hosts, we added in oVirt 3.5 an annotation called UnchangableByVdsm that should be put on every field in VmDynamic class that is not expected to be reported by the hosts. This was supposed to eliminate redundant saves of unchanged runtime data to the database.</p>

<h3 id="split-hosts-monitoring-and-vms-monitoring">Split hosts-monitoring and VMs-monitoring</h3>
<p>Previously, before monitoring a host we locked the host and released it only after the host-related information and all information of VMs running on the host was processed. As a result, when doing an operation on a running VM, the host that the VM ran on was locked.<br />
A major change in oVirt 3.5 was a refactoring the monitoring to use per-VM lock instead of the host lock while processing VM runtime data. That reduced the time that both monitoring and threads executing commands are locked.</p>

<h3 id="introduction-of-events-based-protocol-with-the-hosts">Introduction of events based protocol with the hosts</h3>
<p>A highly desirable enhancement came in oVirt 3.6 in which changes in VM runtime data are reported as events rather than by polling. In a typical data-center many of the VMs are ‘stable’, i.e. their status does not change much. In such environment, this change reduces the number of data sent on the wire and reduces the unnecessary processing in oVirt-engine.<br />
Note that not all monitoring cycles were replaces with events: on every 15 seconds (by default), oVirt-engine still polls the statuses of all VMs, including their statistics. These cycles are called ‘statistics cycles’.</p>

<h2 id="scope-of-this-work">Scope of this work</h2>
<p>An indication that monitoring is inefficient is when it works hard while the system is stable (I prefer the term ‘stable’ over ‘idle’ since the virtual machines could actually be in use). For example, when virtual machnines don’t change (no operation is done on these VMs and nothing in their environment is changed), one could expect the monitoring not to do anything except for processing and persisting statistics data (that is likely to change frequently).</p>

<p>Unfortunately it was not the case in oVirt. The next figure shows the ‘self time’ of hot-spots in the interaction with the database in oVirt 3.6 during the time an environment with one host and 6000 VMs was stable for one hour. I will elaborate on these number later on, but for now just note that the red color is the overall execution time of database queries/updates. The more red color we see, the more busy the monitoring is.</p>

<p><img src="http://ahadas.github.io/images/ovirt_scale/3.6-self_time.png" alt="Execution time of DB queries in stable 3.6 environment" /></p>

<p>This work continues the effort to improve the monitoring in oVirt mentioned in the previous sub-section in order to address this particular problem. In the next section, I elaborate on the changes we did that lead to the reduced execution times shown in the next figure for the same enviroment and for the same time (look how much less red color!).</p>

<p><img src="http://ahadas.github.io/images/ovirt_scale/master-self_time.png" alt="Execution time of DB queries in stable 4.1 environment" /></p>

<p>This work:</p>

<ul>
  <li>Takes for granted that the monitoring in oVirt hinders its scalability.</li>
  <li>Does not change hosts monitoring.</li>
  <li>Does not refer to other optimizations we did that do not improve monitoring of a stable system.</li>
</ul>

<h1 id="changes">Changes</h1>

<h2 id="not-to-process-numa-nodes-data-when-not-needed">Not to process numa nodes data when not needed</h2>
<p>We saw that a significant effort was put to process runtime data of numa nodes.<br />
In terms of CPU time, 8.1% (which is 235 seconds) was wasted on getting all numa nodes of the host from the database and 5.9% (which is 170 seconds) was wasted on getting all numa nodes of VMs from the database. The overall CPU time spent on processing numa node data got up to 14.6%! This finding is similar to what we saw in profiling dump we got for other scaled environment.<br />
In terms of database interaction, getting this information is relatively cheap (the following are average numbers in micro-seconds):</p>

<ul>
  <li>261 to get numa nodes by host</li>
  <li>259 to get assigned numa nodes</li>
  <li>255 to get numa node CPU by host</li>
  <li>246 to get numa node CPU by VM</li>
  <li>242 to get numa nodes by VM</li>
</ul>

<p>But these queries are called many times so the overall portion of these calls is significant:</p>

<ul>
  <li>Getting numa nodes by host - 3% (48,546 msec)</li>
  <li>Getting assigned numa nodes - 3% (48,201 msec)</li>
  <li>Getting numa node CPU by host - 3% (47,569 msec)</li>
  <li>Getting numa node CPU by VM - 2% (45,918 msec)</li>
  <li>Getting numa nodes by VM - 2% (45,041 msec)</li>
</ul>

<p>I used the term ‘wasted’ because my host did not report any VM related information about numa nodes! So in order to improve this we changed the analysis of VM’s data to skip processing (and fetching from the database) numa related data if no such data is reported for a VM.</p>

<h2 id="memoizing-hosts-numa-nodes">Memoizing host’s numa nodes</h2>
<p>But we cannot assume that hosts do not report numa nodes data for the VMs. So another improvement was to reduce the number of times it takes to query host’s level numa nodes data - by querying it on per-host basis instead of per-VM. That’s ok since this data does not change while we process data received from the host. We used the memoization technique to cache this information during host monitoring cycle.</p>

<h2 id="cache-vm-jobs">Cache VM jobs</h2>
<p>Another surprising finding was to see that we put a not negligible effort in processing and updating VM jobs (that is, jobs that represent live snapshot merges) without having a single job like that (the system is stable, remember?). <br />
It gots up to 3.8% (111 sec) of the overall CPU time and 3% (47,140 msec) of the overall database interactions.</p>

<p>Therefore, another layer of in-memory management of VM jobs was added. Only when this layer detects that information should be retrieved from the database (and not all the data is cached) it access the database.</p>

<h2 id="reduce-number-of-updates-of-dynamic-vm-data">Reduce number of updates of dynamic VM data</h2>
<p>Despite the use of @UnchangableByVdsm, I discovered that VM dynamic data (that includes for example, its status, ip of client console that is connected to it and so on) is updated. Again, no such update should occur in a stable system… The implications of this issue is significant because this is a per-VM operation so the time it takes is accumulated and in our environment got to 6% (101 sec) of the overall database interactions.</p>

<p>To solve this, VmDynamic was modified. Some of the fields that should not by compared against the reported data were marked with @UnchangableByVdsm and some fields that VmStatistics is a more appropriate place for them were moved.</p>

<h2 id="split-vm-devices-monitoring-from-vms-monitoring">Split VM devices monitoring from VMs monitoring</h2>
<p>Hosts report the hash of the devices of each VM and the monitoring of the VMs used to compare this hash against the hash that was reported before, and triggers a poll request for full VM data, that contains information of the devices, only when the hash is changed. Not only that the code became more complicaed when it was tangled within other VM analysis computation, but a change in the hash triggered update of the whole VM dynamic data.</p>

<p>Therefore, we split the VM devices monitoring into a separate module that caches the device hashes and by that reduce even further the number of updates of VM dynamic data.</p>

<h2 id="lighter-dedicated-monitoring-views">Lighter, dedicated monitoring views</h2>
<p>Another observation from analyzing hot spots in the database interactions was that one of the queries we spend a lot of time on is the one for getting the network interface of the monitored VMs. This is a relatively cheap query, only 678 micro-sec on average, but it is called per-VM that therefore accumulated to 8% (126 sec) of the overall database interactions.</p>

<p>The way to improve it was by introducing another query that is based on a lighter view of network interfaces that contains only the information needed for the monitoring.</p>

<p>This technique was also used to improve the query for all VMs running on a given host. The following output depicts how much lighter is the new view (vms_monitoring_view) than the previous view the monitoring used (vms):</p>

<div class="language-plaintext highlighter-rouge"><div class="highlight"><pre class="highlight"><code>engine=&gt; explain analyze select * from vms where run_on_vds='043f5638-f461-4d73-b62d-bc7ccc431429';
 Planning time: 2.947 ms  
 Execution time: 765.774 ms
engine=&gt; explain analyze select * from vms_monitoring_view where run_on_vds='043f5638-f461-4d73-b62d-bc7ccc431429';
 Planning time: 0.387 ms
 Execution time: 275.600 ms
</code></pre></div></div>

<p>This new view is used by the monitoring in oVirt 4.0 but as we will see later on the monitoring in oVirt 4.1 won’t use it anymore. Still, this new view is used in several other places instead of the costly ‘vms’ view.</p>

<h2 id="in-memory-management-of-vm-statistics">In-memory management of VM statistics</h2>
<p>The main argument for persisting data into a database is its ability to store information that should be recoverable after restart of the application. However, in oVirt the database is many times used in order to share data between threads and processes. This badly affects performance.</p>

<p>VM statistics is a type of data that is not supposed to be recoverable after restart of the application. Thus, one could expect it not to be persisted in the database. But in order share the statistics with thread that queries VMs for clients and with DWH, it used to be persisted.</p>

<p>As part of this work, VM statistics is no longer persisted into the database. They are now managed in-memory. Threads that query VMs for clients retrieve it from the memory, and for DWH we can dump the statistics in longer intervals to wherever it takes the statistics from. By not persisting the statistics, the number of saves to the database it reduced. In our environment it got to 2% (38,669 msec) of the overall database interactions. It also reduces the time it takes to query VMs for clients.</p>

<h2 id="query-only-vm-dynamic-data-for-vm-analysis">Query only VM dynamic data for VM analysis</h2>
<p>So ‘vms_monitoring_view’ turned out to be much more efficient than ‘vms’ view as it returned only statistics, dynamic and static information of the VM (without additional information that is stored in different tables).</p>

<p>But obviously querying only the dynamic data is much more efficient than using the vms_monitoring_view:</p>

<div class="language-plaintext highlighter-rouge"><div class="highlight"><pre class="highlight"><code>engine=&gt; explain analyze select * from vms_monitoring_view where run_on_vds='043f5638-f461-4d73-b62d-bc7ccc431429';
 Planning time: 0.405 ms
 Execution time: 275.850 ms
engine=&gt; explain analyze select * from vm_dynamic where run_on_vds='043f5638-f461-4d73-b62d-bc7ccc431429';
 Planning time: 0.109 ms
 Execution time: 2.703 ms
</code></pre></div></div>
<p>So as part of this work, not only that VM statistics are no longer queried from the database but also the static data of the VM is no longer queried from the database by the monitoring. Each update is done through VmManager that caches only the information needed by the monitoring and the monitoring uses this data instead of getting it from the database. That way, only the dynamic data is queried from the database.</p>

<h2 id="eliminate-redundant-queries-by-vm-pools-monitoring">Eliminate redundant queries by VM pools monitoring</h2>
<p>Not directly related to VMs monitoring, VM pool monitoring that is responsible for running prestarted VMs also affects the amount of work done in a stable system. As part of this work, the amount of interactions with the database by VM pool monitoring in system that doesn’t contain prestarted VMs was reduced.</p>

<h1 id="results">Results</h1>

<h2 id="cpu">CPU</h2>
<p>CPU view on oVirt 3.6:<br />
<img src="http://ahadas.github.io/images/ovirt_scale/3.6-cpu.png" alt="CPU view on 3.6" /></p>

<p>CPU view on oVirt master:<br />
<img src="http://ahadas.github.io/images/ovirt_scale/master-cpu.png" alt="CPU view on master" /></p>

<ul>
  <li>The total CPU time used in one hour for the monitoring reduced from 2297 sec to 1789 sec.</li>
  <li>We spend significantly less time in the monitoring code - 814 sec instead of 1451 sec.
    <ul>
      <li>The processing time reduced from 896 sec to 687 sec.</li>
      <li>The time it takes to persist changes to the database reduced from 546 sec to 114 sec.</li>
    </ul>
  </li>
</ul>

<p>Additional insight:</p>

<ul>
  <li>The time spent on host monitoring increased from 40,730 msec in oVirt 3.6 to 53,447 msec when using ‘vms_monitoring_view’. Thus, in 4.0 it is probably even higher due to additional operations that were added.</li>
</ul>

<h2 id="database">Database</h2>
<p>Database hot spots on oVirt 3.6:<br />
<img src="http://ahadas.github.io/images/ovirt_scale/3.6-db.png" alt="DB hot-spots on 3.6" /></p>

<p>Database hot spots on oVirt master:<br />
<img src="http://ahadas.github.io/images/ovirt_scale/master-db.png" alt="DB hot-spots on master" /></p>

<ul>
  <li>The time to query network interfaces of VM reduced from 678 micro-sec on average to 282 micro-sec, resulting in overall improvement from 126 sec to 108 sec (it is called much more, I believe it is because postgres caches this differently now).</li>
  <li>The time it takes to query all the running VMs on the host reduced from 3,539 msec on average (!) to 909 msec, resulting in overall improvement from 113 sec to 59,130 msec thanks to querying only the dynamic data.</li>
  <li>The time it took to save the dynamic data of the VMs was 101 sec (6%, 544 micro-sec on average). On master, the dynamic data was not saved at all.</li>
  <li>All queries for numa nodes that were described before were not called on our environment.</li>
  <li>Same for the query of VM jobs.</li>
  <li>The update of VM statistics which took 261 micro-sec and 38,669 msec overall (2%) on oVirt 3.6, is not called anymore.</li>
  <li>Queries related to guest agent data on network interfaces that we spend time on in oVirt 3.6 (insert: 319 micro-sec on average, 59,493 msec overall which is 3% and delete: 223 micro-sec on average, 41,605 msec overall which is 2%) were not called on oVirt master.</li>
</ul>

<p>More insights:</p>

<ul>
  <li>Despite making the ‘regular’ VMs query lighter (since it does not include querying VM statistics from the database), it takes significatly more time on oVirt master: 996 msec on average while it used to be ~570 msec on average on oVirt 3.6.</li>
  <li>Updates of the dynamic data of disks seems to be also inefficient. Although it is relatively cheap (143 micro-sec on average) operation, the fact that it is done per-VM makes the overall time relatively high on master (4%), especially considering that these VMs had no disks..</li>
  <li>The overall time spent on querying VM network interfaces is still too much.</li>
  <li>An insight that I find hard to explain is the following diagrams of the executed database statements that are probably a result of caching in postgres (that might explain the reduced memory consumption we will see later):</li>
</ul>

<p>Executed statements in oVirt 3.6:<br />
<img src="http://ahadas.github.io/images/ovirt_scale/3.6-statements.png" alt="db statements on 3.6" /></p>

<p>Executed statements in oVirt master:<br />
<img src="http://ahadas.github.io/images/ovirt_scale/master-statements.png" alt="memory on master" /></p>

<h2 id="memory">Memory</h2>
<p>Memory consumption on oVirt 3.6:<br />
<img src="http://ahadas.github.io/images/ovirt_scale/3.6-memory.png" alt="memory on 3.6" /></p>

<p>Memory consumption on oVirt master:<br />
<img src="http://ahadas.github.io/images/ovirt_scale/master-memory.png" alt="memory on master" /></p>

<p>One can argue that in-memory management like the one introduced for VM statistics or in-memory management layers over the database like the one introduced for VM jobs leads to high memory consumption.</p>

<p>Surprisingly, the memory consumption on master is lower than the one seen on 3.6. While at peaks (right before the garbage collector cleans it) the memory on oVirt 3.6 get to ~1.45 GB, on oVirt master it gets to ~1.2 GB. That is probably thanks to other improvements or by reducing the amount of caching by postgres that compansate the higher memory consumption by the monitoring.</p>

<h1 id="possible-future-work">Possible future work</h1>

<ul>
  <li>Although I refer to the code that includes the described changes as ‘master branch’, some of the changes are not yet merged so this work is not completed yet.</li>
  <li>Need to investigate what makes VMs query to take much longer on the master branch.</li>
  <li>Another improvement can be to replace the ‘statistics cycles’ polling with events. This could also prevent theoretical issues we currently have in the monitoring code.</li>
  <li>In order to create the testing environment I played a bit with environment running 6000 VMs (using fake-VDSM). It is very inconvenient via the webadmin currently. Better UI support for batch operations is something to consider.</li>
  <li>Also, we had an effort to introduce batch operations for operations on the hosts (like Run VM). We could consider batch scheduling that will allow us to resume that effort.</li>
  <li>Introduce in-memory layers for network interface and dynamic disk data as well.</li>
  <li>Split VM dynamic data to runtime data, that is reported by VDSM, and other kind of data to prevent redundant updates from happening again.</li>
  <li>Cache VM dynamic data. We planned to do it for VM statuses, but we should consider doing that for other kind of dynamic VM data.</li>
</ul>]]></content><author><name></name></author><summary type="html"><![CDATA[Recently I’ve been working on improving the scalability of monitoring in oVirt. That is, how to make oVirt-engine, the central management unit in the oVirt management system, able to process and report changes in a growing number of virtual machines that are running in a data-center. In this post I elaborate on what we did and share some measurements.]]></summary></entry></feed>